Free Photography Bundle ($180 value): PS actions, LR presets, photo overlays, & print templates!
Get it here.
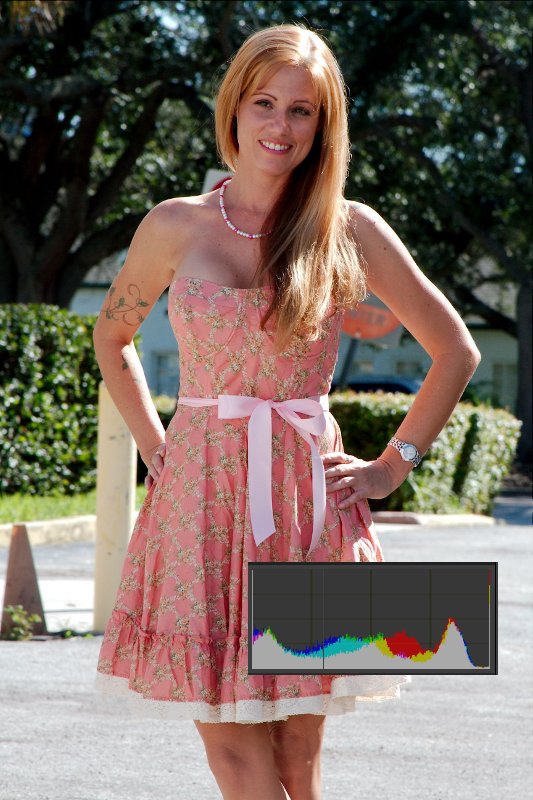
This histogram tells me the exposure is about as good as it’s going to get for this shot.
It’s a mistake to look at a picture in the LCD screen of your camera and think that’s exactly how it’s going to look when you import it into your photo management program. At best the LCD screen is a close approximation; much better now than just a few years ago, but there can be a world of difference between your camera’s LCD and your computer screen, and some details are lost in a screen that small.
Fortunately most modern DSLRs already have a built-in “equalizer” for images called a histogram. A histogram is a graphical display of the tonal range of picture across the dynamic range of the sensor measured in f-stops. The peaks in the graph are the representation of the intensity of a particular part of the tonal range, with shadows on the left and the lighter tones all the way to the right, 18 percent gray should be right in the middle. The height of the peak represents the relative number of pixels sharing that tone.
Some of this gets into a fairly technical discussion of how an image sensor records data, including bit depth and dynamic range that will make most people’s eyes glaze over, so I’ll try to keep this focused on the practical aspects of using a histogram to take better pictures.
Conveniently, most cameras will display that histogram for you right in the camera. Checking the histogram in the field can give you a lot of information about the tonal range of your subject and options for exposure. Some cameras and editing programs will also show you color histograms that show which colors are dominating a particular photo. For illustration, I left the color peaks on so you can see the difference.
In a picture dominated by midtones the histogram points out I was losing highlights.
Proper Exposure Not Always What You Want
Your camera computer is going to do its level best to give you the best average exposure it can calculate from a sampling of various points in the frame. If you want an average exposure, that’s great. Most outdoor shots are going to be fine using averaged tonal values. It’s not until you want to isolate a subject or change the nature of the photograph by deliberately skewing the exposure will you need to think about using your camera’s histogram.
The Change You Want
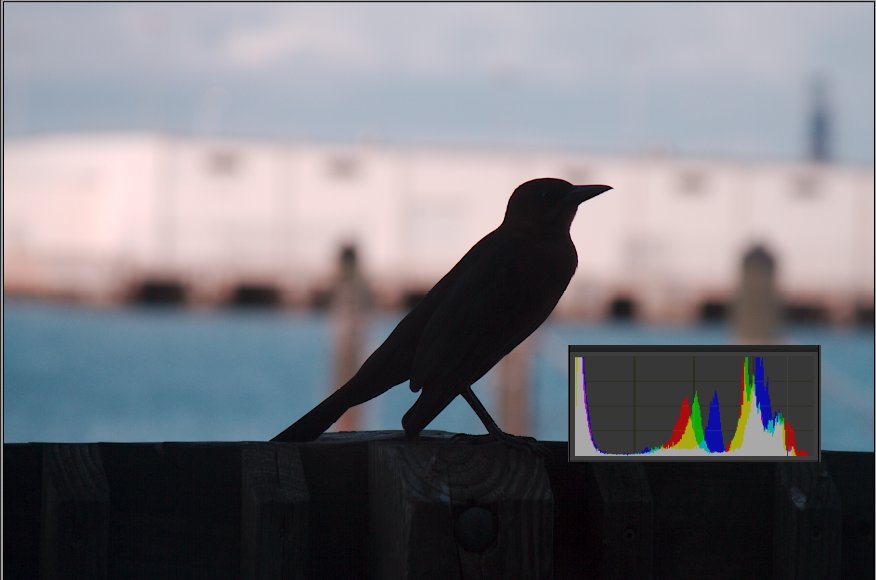
The histogram says the bird is so underexposed the detail is lost, which is just fine for this shot.
Take the picture of the bird in silhouette. If you leave your camera on the Auto settings, it’s going to try and light that big dark blob in the middle by turning on the camera flash, but I deliberately exposed for the buildings in the background and left the bird so far underexposed notice how the dark tones in the histogram (to the left) look like they’re cut off. That’s telling me there are elements in the photo so far underexposed they’re losing detail. If you wanted to preserve any detail in the bird, you’d want to blow out the background and expose for the foreground (high key) or turn on the flash to equalize the values.
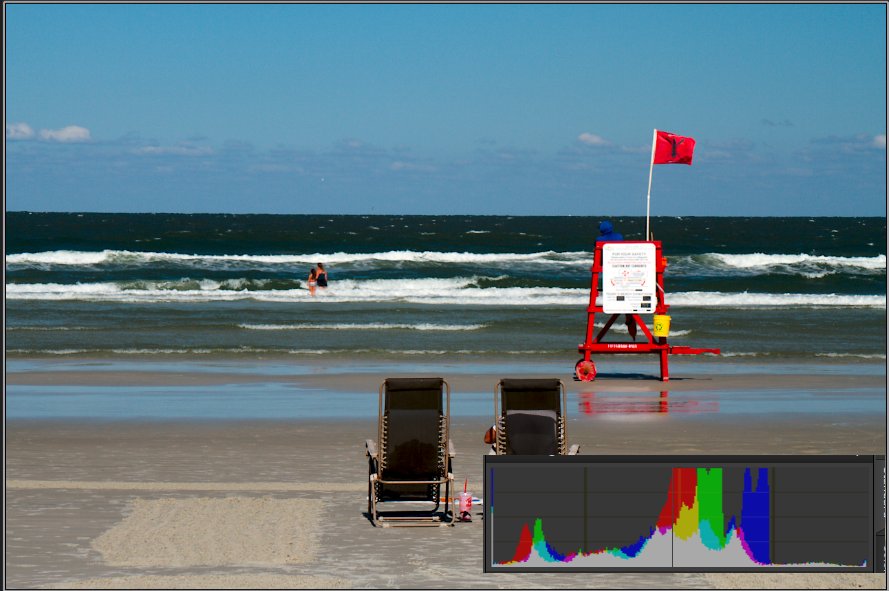
Looking at the beach picture and you’ll see a picture dominated by midtones with a tiny peak in the lower right hand corner of the histogram. Notice that too looks like it’s been cut off. That tells you there’s some peaking of the highlights going on; so bright that the details in the waves are getting blown out. In that photo it’s fine, but imagine if that was a shot of a woman wearing a white dress…like a wedding dress. Still okay with the blown out highlights or do you think maybe you’d want to expose for the dress, bring the clipping down a bit and sacrifice some of the darker elements? Depends on the picture, but probably.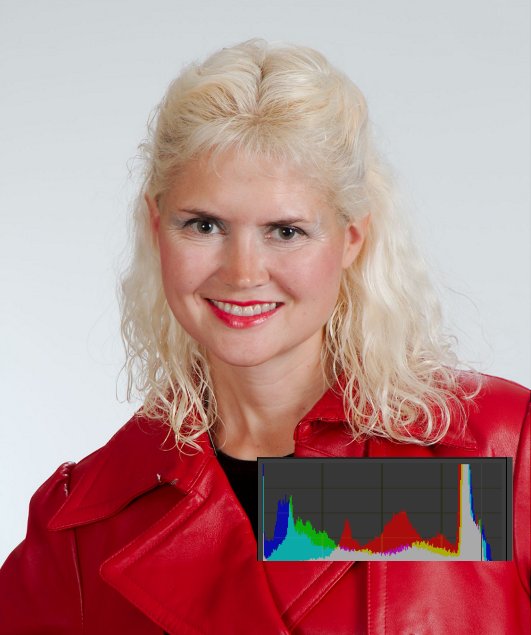
The picture of the woman in the red jacket was taken in a photography studio with all manual settings. In this case the highlight peak in the histogram told me we didn’t have the lighting quite where we wanted because the highlight peak wasn’t cut off. We had two Alien Bee kickers set up to light the background and the idea was to totally blow it out, but in that shot we’re not getting the desired effect. There’s a nice peak on the white end of the tonal scale but it’s not blown out. We cranked up the kickers to full power to solve that problem.
That’s the kind of quality feedback you can get from a histogram working in the field. You’ll know if you’re losing highlights and whether your pictures are properly exposed, regardless of what you see in the LCD. When working in the studio I look at the histograms more than the pictures themselves. I can see what the image looks like in the frame, but what’s important is how the image sensor sees it.
Using your camera’s histograms will teach you how your imaging sensor sees the world and, over time, you’ll be like Neo in The Matrix, looking at the histogram code and seeing the image in your mind.